
How far does a Hamburg HVV ticket take me?
Lab Diary: How we measure Fare Accessibility of Hamburg’s Public Transport System
— diesen Beitrag auf deutsch lesen —
In order to learn more about the everyday mobility of low-income people, we interviewed 20 Hamburg residents who live on “Hartz IV” welfare allowance. Eleven of the interviewees use an HVV monthly/annual pass and one person uses a reduced fare for disabled passengers. The remaining eight rely on single-use fares – i.e., tickets that are valid for a maximum of one day. Many of them report that they find the fare system complicated and restrictive:
“You always have to put money aside at the beginning of the month so that you can afford the bus if you need it. And that’s always, yes, the money that’s actually missing to do something else, to go to a birthday or a museum or something, right?”
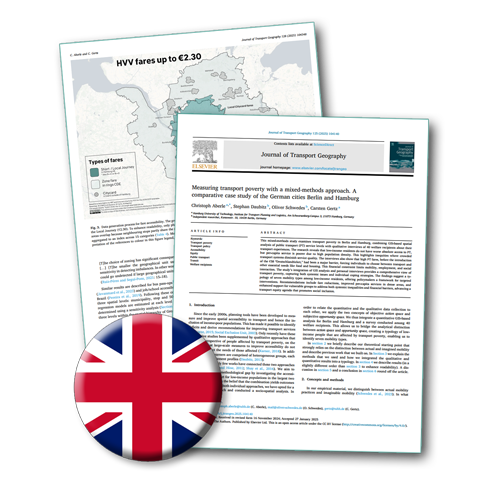
“When I leave Ziegelerstraße to Harburg Rathaus – 1.70 euros. If I take the bus from Ziegelerstraße. If I take the detour via the Wilhelmsburg S-Bahn station and then to Harburg, then I already pay 2.30 or 2.40 euros, because that is not outside the zone and because the S-Bahn costs more. You already pay 70, 80 cents more, right? I think that’s a bit unfair, actually […] So it doesn’t make sense to me. Absolutely not.”
“I walked to school with my daughter for a year and a half, 1.7 kilometres every morning, with three kids […]. A [part-time pass] was not even useful, because my daughter has to be at school at eight. Well, so I walked with the kids. It’s good for them, but it’s still a lot of time and stress for me.”
“When I have an appointment in Hamburg, I always try to buy a day ticket […]. I already do the calculations: […] Where do I have to pay the least, what makes sense? In any case, it’s still a big effort. Because I need the money somewhere else, right?”
In order to comprehend these statements, we calculated how many everyday destinations can be reached with a Short Journey or Local Journey HVV ticket. This involved several steps:
Understanding the HVV fare system
Within the HVV, the fare is based on zones, with several stops within a zone. The zones are divided by fare stages. In most cases, the fare follows these stages: If a fare stage is crossed, the Short Journey fare applies. If another stage is crossed, the Local Journey fare applies.
| Price (EUR) | Fare | Validity | |
|---|---|---|---|
| 1.70 | Short Journey | Up to the first fare stage or trip within central Hamburg | |
| (only within Hamburg AB) | |||
| 2.30 | Local Journey | Up to the second fare stage | |
| (only within Hamburg AB and from ring B to Ring C or D) | |||
| 3.40 | Hamburg AB | Hamburg AB area | |
| As of 2019/20 timetable, simplified |
As zones do not follow standardised boundaries, the single-use fare is not easy to model. This is done with a fare matrix: for each stop, it contains the fare to every other stop. For our study, we can use HVV data from 2019, which we have processed into a fare matrix. This allows us to derive the scope of the Short Journey fare for the Stübenplatz stop in Hamburg-Wilhelmsburg.
Web map: Use the button in the top left corner to open the map in full screen mode. At the top right you can also show the Local Journey fare. Click on a stop to see its name and the current fare:
Defining catchment areas for stops
Now, we know which stops a passenger may travel to if they buy a Short Journey ticket at Stübenplatz. The second question is how far they are willing to walk after getting off the bus. Here we use a standard from the Association of German Transport Companies:1 Depending on the spatial type around the stop (densely/sparsely populated) and the mode of transport (rail/bus&ferry), 5 to 17 minutes walking time are considered acceptable.2
For example, the Wilhelmsburg S-Bahn station belongs to the Inner City spatial type and is served by local trains. Therefore, we assign a long walking distance of ten minutes to the stop – we assume that most passengers are willing to accept a longer walk for the S-Bahn than for the bus.
We simulate this walking distance by virtually walking each every possible route that takes ten minutes. The result is a polygon: the walking isochrone (Greek iso: equal, chronos: time). The isochrone is also called the catchment area. The following map shows isochrones for three stops.
Click on the blue catchment areas:
Counting and weighting destinations
Finally, we want to know how many destinations for daily needs are located within the catchment areas. To do this, we look at all the supermarkets, pharmacies and 17 other categories that lie within the catchment area of each stop.3
The result is the fare accessibility for each stop. It is based on the number of destinations around all possible destination stops within a fare. However, destinations vary in importance: a general practitioner’s office is more important in everyday life than a bookshop. To take this into account, we weighted the destinations into an index.4 We use log values for all categories: The first accessible destination counts heavily in the index, while the second (third, fourth …) counts less. This takes account of the fact that reaching one or no doctors makes a significant difference. The difference between three and four practices, however, is much smaller.
The two boxes show the stops in Hamburg with the highest and lowest fare accessibility.

Fare accessibility:
Railways
Metro, Local Rail, Commuter Trains
| Stop | Short Journey Index |
|---|---|
| Altona | 2.3 |
| St. Pauli | 2.2 |
| Landungsbrücken | 2.2 |
| … | |
| Median | 0.9 |
| … | |
| Elbbrücken | -0.7 |
| Ohlstedt | -0.8 |
| Langenfelde | -0.8 |
| Total Stop Count | 134 |

Fare accessibility:
Bus and Ferry
Bus and Ferry
| Stop | Short Journey Index |
|---|---|
| Kleine Seilerstraße | 2.2 |
| Sievekingplatz | 2.0 |
| Moorstraße | 1.8 |
| … | |
| Median | -0.1 |
| … | |
| Feuerwehrakademie Hamburg | -1.6 |
| Reitbrooker Mühle | -1.7 |
| Moorwerder Hauptdeich 69 | -1.8 |
| Total Stop Count | 1897 |
Boxes: HVV stops in Hamburg from which the most/least destinations can be reached with a Short Journey ticket. The index reflects the weighted number of destinations that can be reached from the respective stop. It is z-transformed, i.e. normalised to a mean value of 0 and a standard deviation of 1. The higher the index, the greater the accessibility.
The following map shows the fare accessibility of all stops in Hamburg. The darker a stop, the more destinations can be reached.
Click on the bus stops. At the top right you can show all the bus stops. The full screen button is on the bottom left:
The map shows that fare accessibility – like almost all accessibility measures – reflects the centrality of a stop: More destinations can be reached from central stops with a high density of use in the surrounding area than from non-central stops. Although the fare accessibility takes into account the influence of density (as explained above under “catchment areas”), it cannot fully compensate for the interaction between centrality and accessibility. Therefore, the usefulness of fare accessibility must be questioned on a large scale: Since it primarily measures the centrality of a stop, it does not add much value compared to traditional accessibility measures such as daily departures at a stop.
How much mobility does a fare allow?
However, fare accessibility can provide benefits on a neighbourhood scale, as the map below shows. It shows the area that can be reached from the Stübenplatz stop in Wilhelmsburg. Compared to certain destinations, the Short Journey index can contribute to the discussion of whether public transport offers sufficient accessibility in terms of financial costs:
In the example, it is not possible to reach a food bank with a Short Journey ticket. The nearest food banks in Harburg require a Local Journey ticket.
Food banks in the centre of Hamburg are inaccessible, although St. Pauli could at least be reached by a longer walk through the Elbe tunnel (northern extension of the green “Local Journey” polygon on the map). However, to get to the centre by public transport, you need to buy a single Hamburg AB ticket at a cost of 3.40 EUR. For a return trip on the same day, the cheapest ticket is a a 9 am Day ticket at 6.60 EUR. Assuming that people living on “Hartz IV” have a budget of 35 EUR,5 they would be able to visit the city centre five times a month, while each of their 9 am Day tickets would be valid on the entire Hamburg AB.
For the majority of low-income residents, the HVV fare thus offers at least a basic level of mobility: 83 percent of “Hartz IV” recipients can reach all categories of daily needs6 within the Short Journey at 1.70 euros per trip. If multi-day needs are included, however,7 the percentage drops sharply. Now only 4 per cent of those affected reach at least one destination in each category. And to stay with the example of food banks: Around 21 percent of “Hartz IV” recipients have to pay at least 3.40 per direction to reach a distribution point.
A contribution to the debate on the affordability of public transport
Fare accessibility helps to measure the financial affordability of public transport. It can also be used to evaluate measures that affect the utility of single tickets. The metric complements the operator’s perspective with that of the low-income passenger (which is far less common in Germany than in the US or in the UK). While the information gain on a city-wide scale is questionable, the Short Journey index can contribute to the discussion on the affordability of public transport at a neighbourhood level. This is especially the case for low-income groups, for whom public transport is particularly important8. After all, fare accessibility is not just about the number of stops that can be reached with a single ticket – it is also about the potential for inclusion that a fare system opens up.
➽ Learn more: Paper on fare accessibility
We describe our methodology in detail in the Journal of Transport Geography:
Download
Does a short journey get me to the food bank?
An empirical study on fare-based public transport accessibility
and its implications for social equity
Journal of Transport Geography
Volume 128, October 2025, 104348
DOI: 10.1016/j.jtrangeo.2025.104348
PhD student at the TUHH Institute for Transport Planning, responsible for the MobileInclusion project. Addicted to public transport.
Main responsibilities: Geographical analysis of transport disadvantage, public relations.
- Allgemeiner Ausschuss für Planung (2019). VDV-Schrift 4: Verkehrserschließung, Verkehrsangebot und Netzqualität im ÖPNV. Köln. ↵
- To be precise, the VDV does not consider the spatial type, but measures density in terms of population and jobs per hectare. As we do not have this data, we use Gesa Matthes’ spatial typology of Hamburg ↵
- Our target categories: Food retailing, pharmacy, doctor’s office, park/forest, allotment garden, hospital, food bank, job centre, day care, primary school, playground, meeting place, swimming pool, cemetery, bookshop, public library, post office, bank, self-help group.
Almost all the destinations come from OpenStreetMap. The doctors’ offices are not from OSM, but from the Hamburg Doctors’ Association. The food banks we mapped ourselves ↵ - For the index, we discussed the results of 40 interviews in Berlin and Hamburg and created an index that adds up to 100 points. The main categories are food retailing (15% weight), GP care (12%), parks/forests and daycare (10% each) ↵
- The “Hartz IV” allowance provides 34.62 EUR per month for transport expenses (Böker 2018). On 1 January 2021 it is to be increased to 39.01 EUR (DIE ZEIT 32/2020). ↵
- destinations of daily needs: grocery retailing, doctor’s office, park/forest, pharmacy, allotment garden ↵
- Destinations for multi-day needs: the above, plus hospital, food bank, job centre, day-care, primary school, playground, meeting place, swimming pool, cemetery, bookshop, public library, post office, bank branch, self-help group ↵
- Among Hamburg residents in the lowest income bracket, 47% use public transport (almost) every day. In the highest income bracket, the share it is only 26%. By contrast, car use increases with income (infas (2019): Ergebnisse der Studie Mobilität in Deutschland (MiD) – Stadt Hamburg. Präsentation für die Metropolregion Hamburg, pp. 17-18). ↵